Part 4 – Monitor your OT and IIoT components with a cloud-based monitoring solution
It’s my pleasure to welcome you to the fourth part of our Cloud and Hybrid IT special. And for this one, we’re going to step beyond the world of IT and into the realms of OT and IIoT. This is of particular interest to companies with an industrial, manufacturing or construction department.
And because my colleague Shaun Behrens is incredibly knowledgeable about OT and IIoT monitoring, I asked him if he would like to share his knowledge with you in this episode. Shaun is so deeply rooted in the Industrial topic, he's almost a robot himself!

I therefore hand over my keyboard to Shaun. Enjoy the adventures around industrial monitoring and OT!
Thanks Sascha🤩. In this post, I’ll briefly describe what OT and IIoT is, and then we’ll take a closer look at Example Inc. to show how to bring industrial components into Paessler PRTG Hosted Monitor. Alright, with all that out that way: let’s get into it!
OT and IIoT
As I said, let’s start with a quick look at the definitions for both OT and IIoT.
What is OT?
Operational technology (OT) is hardware and software that detects or causes a change, through the direct monitoring and/or control of industrial equipment, assets, processes and events. The term has become established to demonstrate the technological and functional differences between traditional information technology (IT) systems and industrial control systems environment, the so-called "IT in the non-carpeted areas".
I like the “non-carpeted areas” description. This might be a factory floor, or an industrial printing press, or any other kind of technology not covered under the traditional IT terminology. Typically these are areas made for machines and equipment rather than for human comfort.
OT also has its own systems and devices, such as Programmable Logic Controllers (PLC), Supervisory control and data acquisition (SCADA) systems, Distributed Control Systems (DCS), and more.
You’ll also find industrial Ethernet equipment, which consists of devices and cables like those in IT, except designed specifically for the harsh conditions of industrial environments (in other words, designed for water resistance, shock resistance, dust resistance and so on).
We won’t go too much into detail about OT here, but we have written extensively about monitoring OT on our blog and website.
💡 Monitoring Industrial IT: defining and getting the data you need
🦾 3 ways PRTG helps you minimize OT blind spots
🏭 Monitoring Modbus in industrial environments
What is the Industrial Internet of Things?
We explained it pretty well on our IT Explained description for IIoT:
IIoT stands for the Industrial Internet of Things and refers to a network of connected devices in the industrial sector. It is a subset of the Internet of Things (IoT). The defining characteristic of connected devices on IIoT networks is that they transfer data without human-to-human or human-to-computer interaction. Connected devices communicate through gateways, which are physical servers that filter data, and transmit it to other devices and software applications.
IIoT sensors collect data from all aspects of the environment. This could be data about machines (for example: motor rotations, the machine’s operating temperature, its availability, etc.), environmental conditions (for example: air temperature, humidity, air quality, air pressure, etc.), or other details about the production process (for example: speed of the assembly line, amount of wasted material, power consumption, etc.).

The OT network of Example Inc.
So what does all of this mean for monitoring OT and the IIoT with Paessler PRTG Hosted Monitor? This is exactly what I’ll demonstrate very soon by using our Example Inc. company as an…erm…example. But first, we need to understand the set up of Example Inc.
You can find out more about the company in the first part of this blog series, but here’s a summary of what’s important for this blog post: Example Inc. produces specialized aviation parts. Production is done primarily in Malaysia, where the production facility is automated and most of the work is done by robots.
Over and above the machines on the production line itself, here’s what can also be found in the OT environment:
- An OPC UA server, which runs the SCADA system.
- A Beckhoff industrial PC.
- Many IIoT sensors and devices collecting data from all aspects of the manufacturing environment (read here to discover more about IIoT devices). The IIoT sensors transmit data using MQTT through an MQTT broker running on the Beckhoff IPC.
- Several PLCs.
There is also an Ethernet network that consists of firewalls, switches, routers and servers.
A good monitoring concept has to cover all of these concepts. ❤️
Monitoring OT and the IIoT
As we’ve seen in parts 1 and 2 of this blog series, Example Inc. already monitors their IT environment with Paessler PRTG Hosted Monitor. But this isn’t enough. Their production environment in Malaysia is important, too.
What happens if their SCADA isn’t running anymore? Well, they would lose the ability to monitor and control their production line.
And what about if the MQTT broker goes down and IIoT devices couldn’t transmit the data they gathered? Crucial information about the production process could be lost.
So it’s clear: Example Inc. want to monitor their OT infrastructure as well as their IT.
To do this, a monitoring tool has to provide out-of-box support for common industry protocols and standards like OPC UA, MQTT, and Modbus. This is exactly what Example Inc. got with PRTG Hosted Monitor.
Let’s take a look at how they implemented monitoring their OT and IIoT.
iOne important thing to remember: Example Inc. has a separate probe installed on their Malaysia site to monitor the network there. This probe sends the monitoring data back to the PRTG Hosted Monitor instance in the cloud.
Here’s an overview of the Malaysian infrastructure in the device tree of PRTG Hosted Monitor:

We’re interested in the devices monitored under “Industrial”, since this is the network of the production floor in Malaysia.
Monitoring industrial Ethernet devices
Industrial Ethernet devices are pretty much the same as their IT brethren, and are monitored by PRTG in the same way. Here Example Inc. is watching the status of several devices: Moxa switches, Meraki wireless devices, a Meraki router and a Fortinet Fortigate firewall.
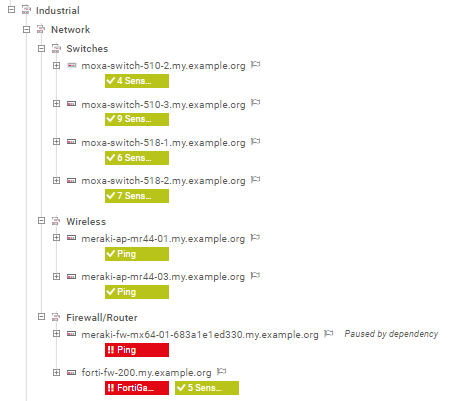
For each of these devices, there are several PRTG sensors monitoring different aspects. Let's take a look at one of the Moxa switches:
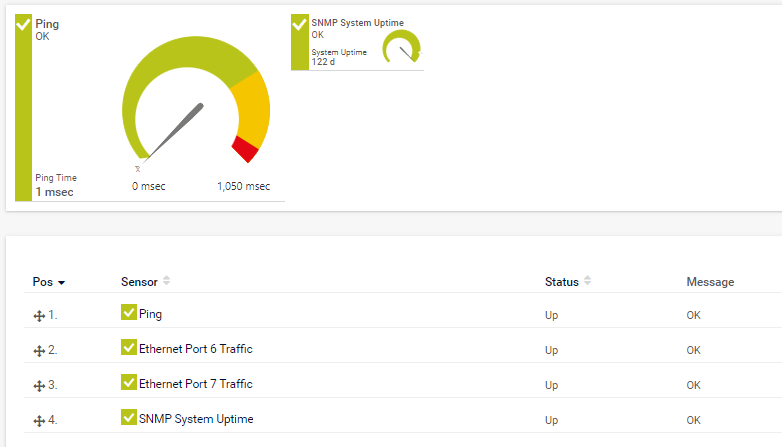
There are four sensors monitoring the Moxa switch:
- Ping sensor to monitor that the switch is up, and the ping time.
- SNMP Traffic sensor to monitor the traffic in and out of ports 6 and 7.
- SNMP System Uptime sensor to monitor how long the system has been up.
For each of these sensors, Example Inc. has defined threshold values. If these thresholds are exceeded, the gauge will turn red and the IT team will receive a notification.
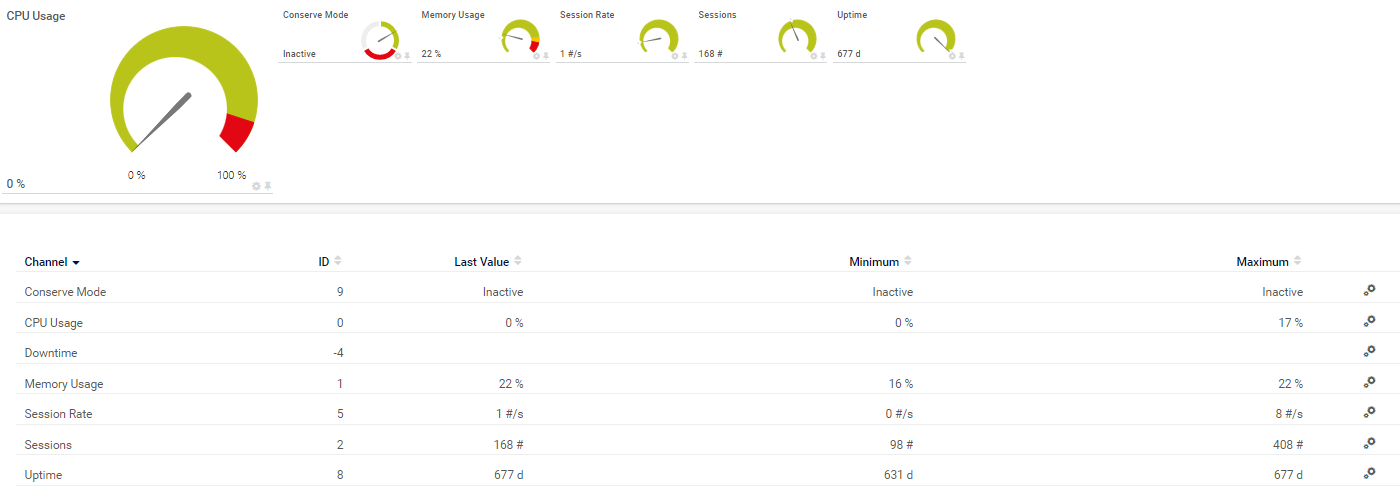
For some of the devices, PRTG Hosted Monitor offers out-of-the box sensors. For example: one of the sensors monitoring the Fortigate firewall is the Fortigate System Statistics sensor:
Monitoring industrial servers and PLCs
There are three devices listed under “Servers” and six under "PLCs":
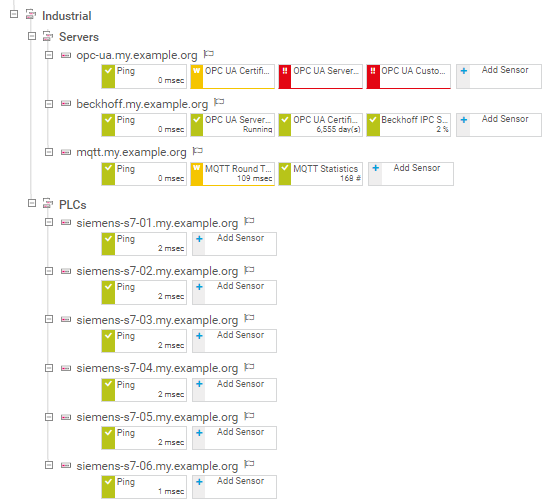
Here’s what they’re monitoring and how:
| OPC UA server health | Using various OPC UA sensors, PRTG Hosted Monitor is tracking the status of the OPC UA server, including when its certificates will expire, the number of OPC UA sessions and rejected sessions, and other metrics. |
| Beckhoff IPC | PRTG Hosted Monitor features a native sensor for monitoring Beckhoff devices, and, because it is an OPC UA server, the OPC UA sensors are also being used. |
| MQTT broker | Using various MQTT sensors, the health and status of the MQTT broker is being monitored to ensure efficient data transmission between IIoT devices. |
| PLCs | The latency of communications with several PLC devices is being monitored to ensure that they are up and running, and that there is no delay in communication. |
Here is a great round-up of these (and other) industrial sensors that PRTG Hosted Monitor provides:
Monitoring IT, OT and the IIoT in the same tool
While being able to monitor OT and IIoT is useful, there’s something even more critical: being able to do it with the same tool.
If you take only one thing from this edition of the PRTG Hosted Monitor guide, it’s this: you don’t want to monitor your infrastructure using several different tools! This can easily happen – you might use one tool for IT, another for OT, and still another for your IIoT devices.
No! Spreading your monitoring concept out like this is a sure-fire way to miss important alerts and drive yourself crazy in the process.
☝️ One of the biggest advantages of using PRTG Hosted Monitor is the ability to have all your monitoring data in the same place.
This means you can create unified dashboards with information from across all parts of your infrastructure, you can create combined alerts and notifications, and much more.
Just like Example Inc.:
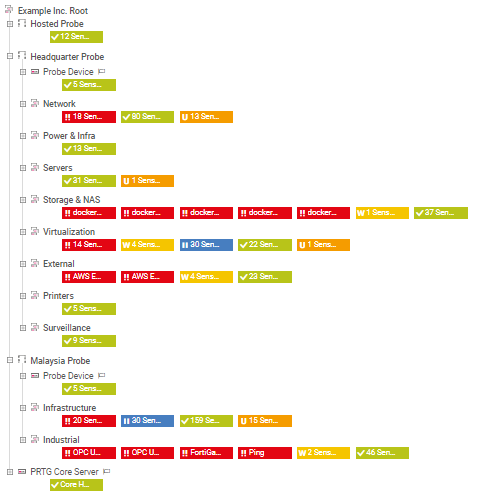
I hope this gave you a plausible insight into the world of OT and IIoT, and showed you how important it is to have a coherent, comprehensive monitoring system. Back to Sascha. 👋
Ok, let's wrap up:
✔️ We considered the important requirements of a cloud-based monitoring tool.
✔️ After that I showed you how to install Paessler PRTG Hosted Monitor to start monitoring right away.
✔️ Together we migrated a system from on-prem to the cloud and learned about different migration methods.
✔️ We swapped the tie for the work gloves, and walked from the office to your OT area, learning how to monitor OT and IIoT components.
⏭️ In the next part, the threads of the previous episodes come together. We combine everything with Paessler PRTG's business process sensors.
Thanks for using this guide ❤️, and stay tuned and excited for our next article in the ultimate guide to monitor your cloud and hybrid IT infrastructure!
