PRTG Enterprise Monitor is scalable monitoring for large IT infrastructures. It is powered by Windows, Servers, ITOps Board, Elasticsearch, SQL, and IIS to provide you with a service-oriented overview across multiple PRTG servers. Check on how to monitor the health state of these components.
If you are running large IT infrastructures and you considering extending your PRTG environment or you are looking for a new network monitoring solution; PRTG Enterprise Monitor is your go-to. It is subscription-based, you start with 20 thousand of sensors and grow per your needs.
PRTG Enterprise Monitor is running on Windows Server and it consists of several components including ITOps Board, Elastic Search, SQL and IIS.
Only available with PRTG Enterprise Monitor, ITOps Board adds a service-oriented overview across multiple PRTG servers, automated alert management, and service-based SLA monitoring and reporting to PRTG.
PAESSLER
PAESSLER
In this article, I will show you how to monitor the PRTG Enterprise Monitor environment using PRTG. In the first place, you need to enable SNMP on your Windows Server. I wrote several articles on how to do it on different operating systems. You can find them here:
- Install and Configure SNMP in Windows Server 2019
- Can you still monitor your Windows Server 2022 with SNMP
For writing this article, I run my workloads on powerful mini PC - Intel NUC powered with the CPU i7 the latest generation, 64 GB RAM DDR4, 256 M.2 SSD. Intel® NUC Mini PCs are fully complete and ready to work out of the box. You can learn more here Intel® NUC Products.Windows Server
This is foundation. Before going deep into monitoring of PRTG Enterprise Monitor components, you should start with monitoring the operating system(s) hosting components.
PRTG Enterprise Monitor (read ITOps Board) is installed on Windows Server. You can monitor your Windows Servers using WMI (Windows Management Instrumentation) and/or SNMP (Simple Network Management Protocol). SNMP creates less performance load on the PRTG Core server, hence I recommend using it.
Here are native SNMP sensors and other sensors you can use to monitor the health state of your Windows Server:
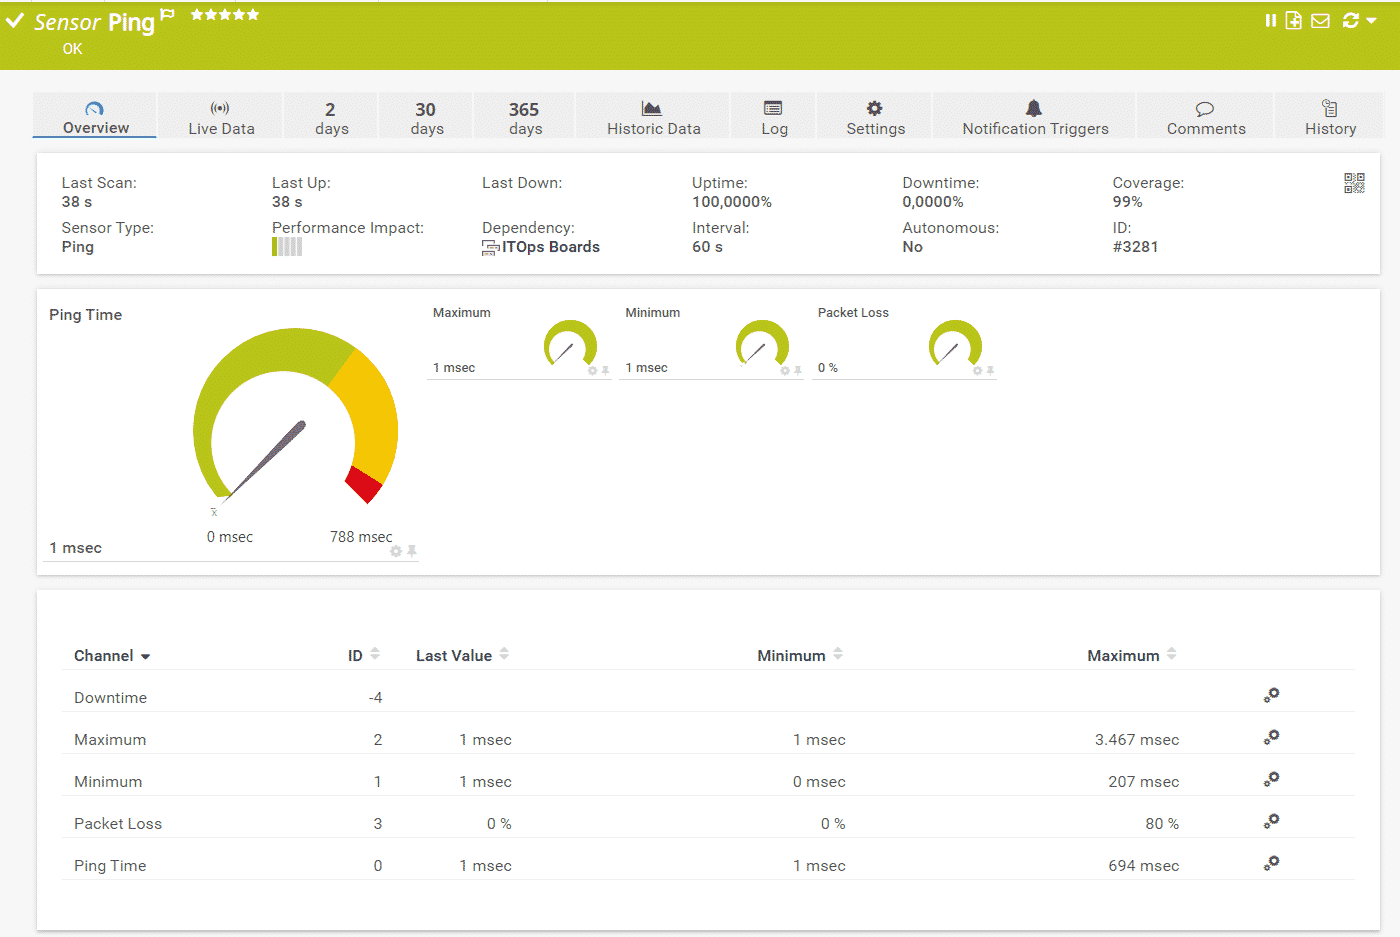
- Ping – monitors device’s availability.
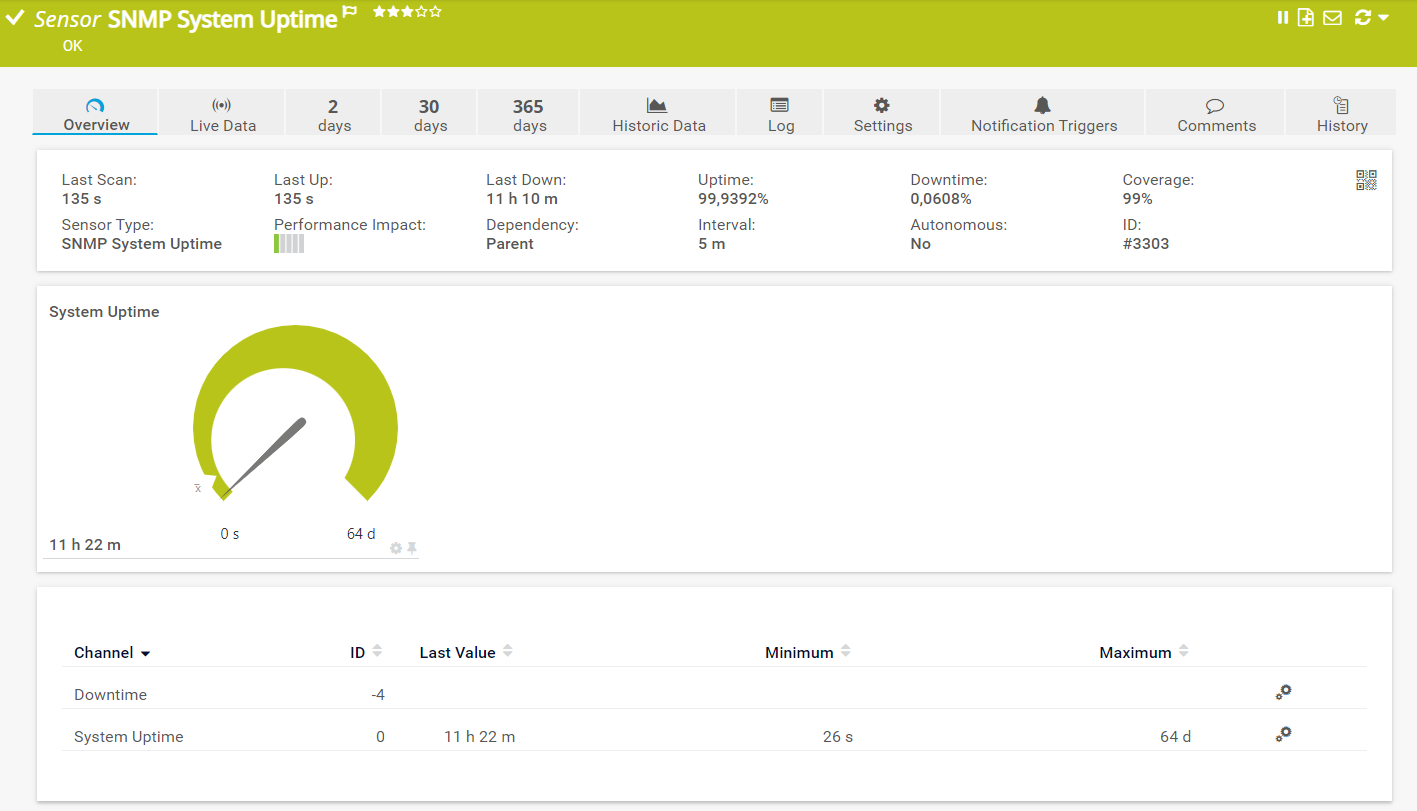
- SNMP System Uptime – monitors the uptime of a device.
- SNMP CPU Load – monitors the system load.
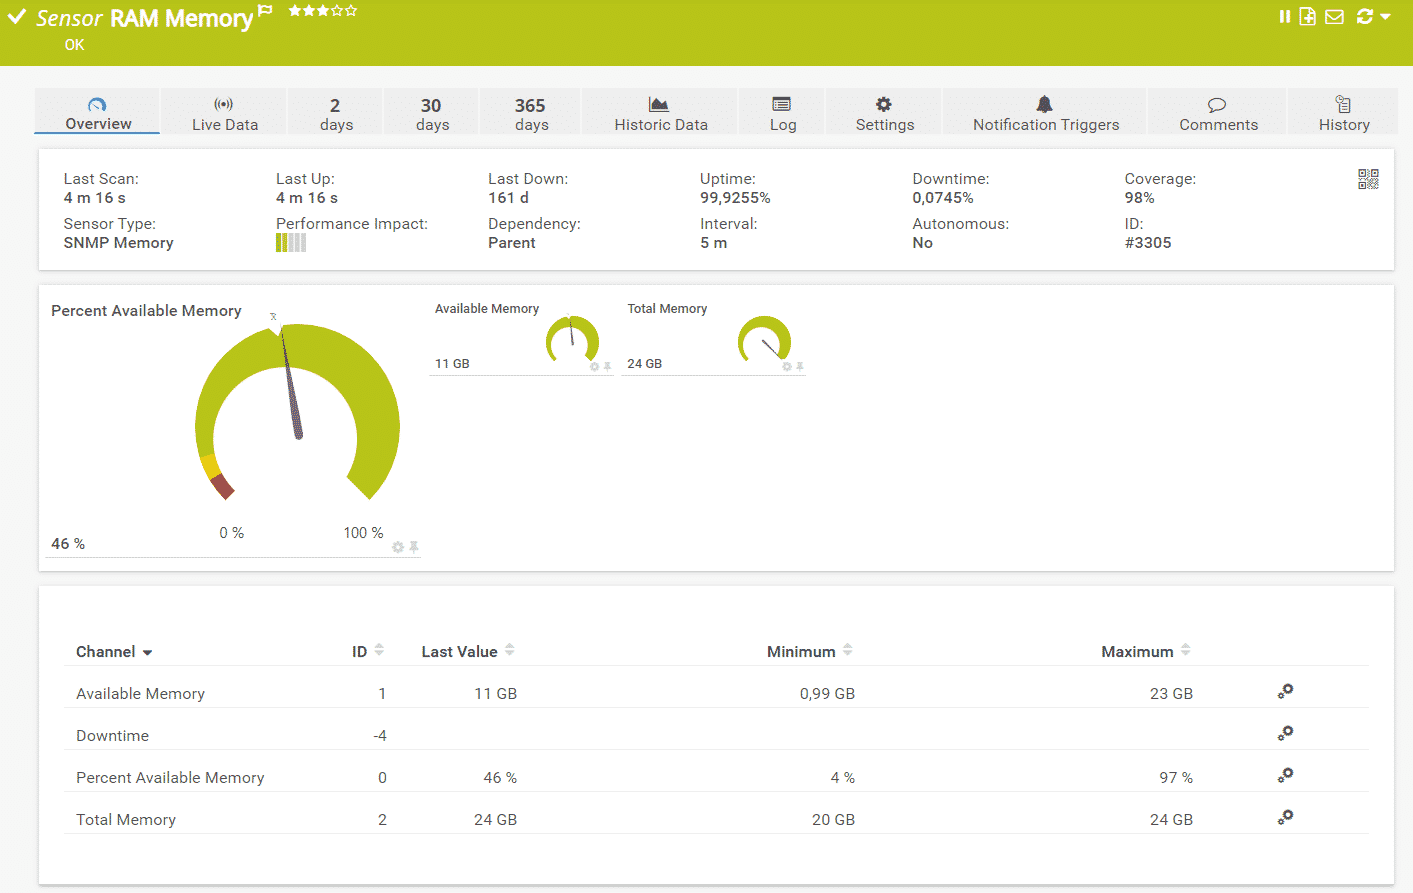
- SNMP Memory – monitors the memory usage of a system.
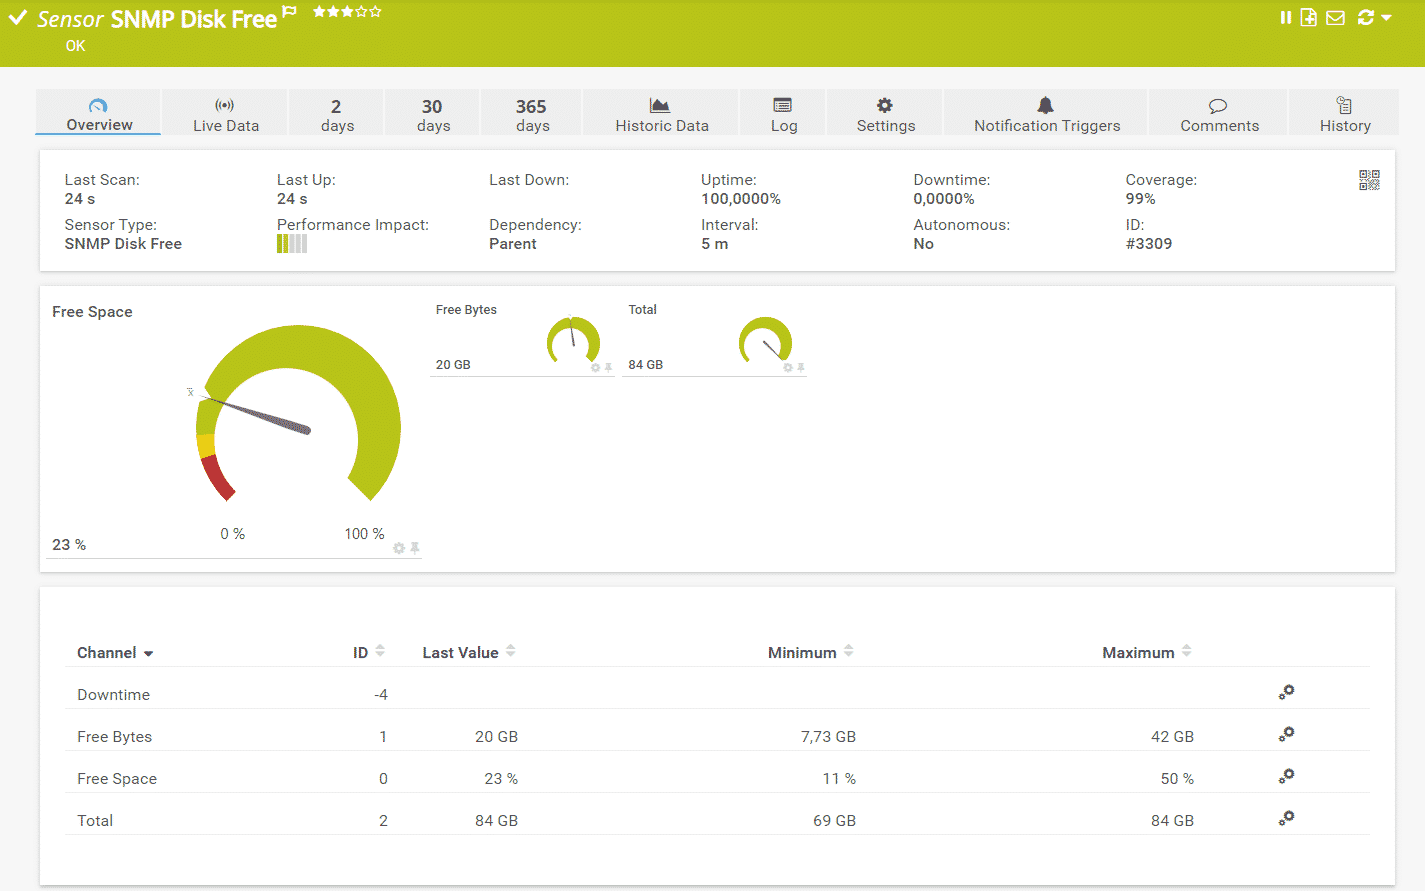
- SNMP Disk Free Space – monitors the free disk space on a logical disk.
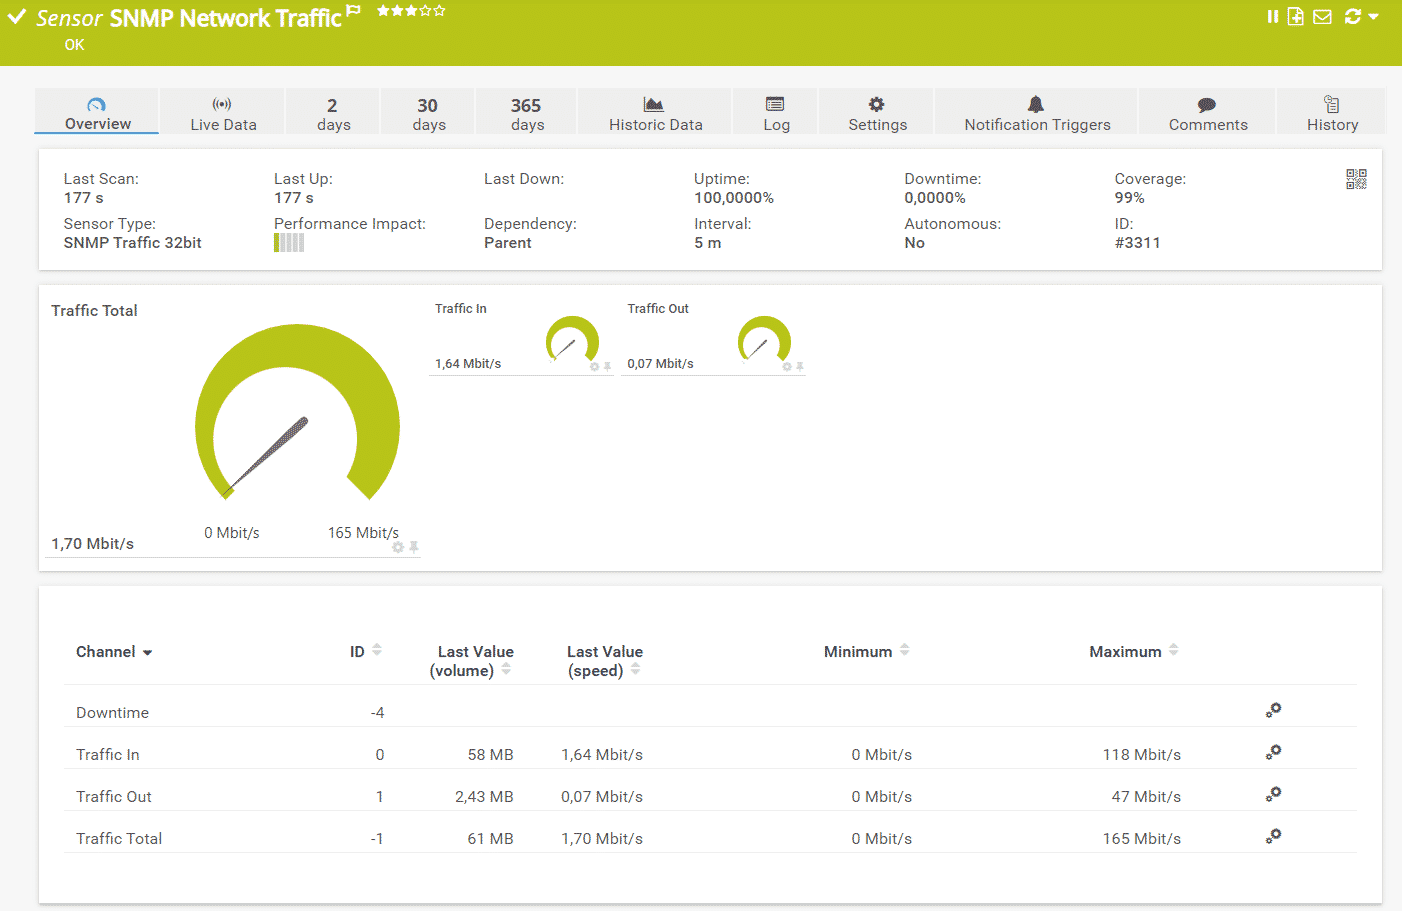
- SNMP Traffic – monitors incoming, outgoing and total traffic on a device.
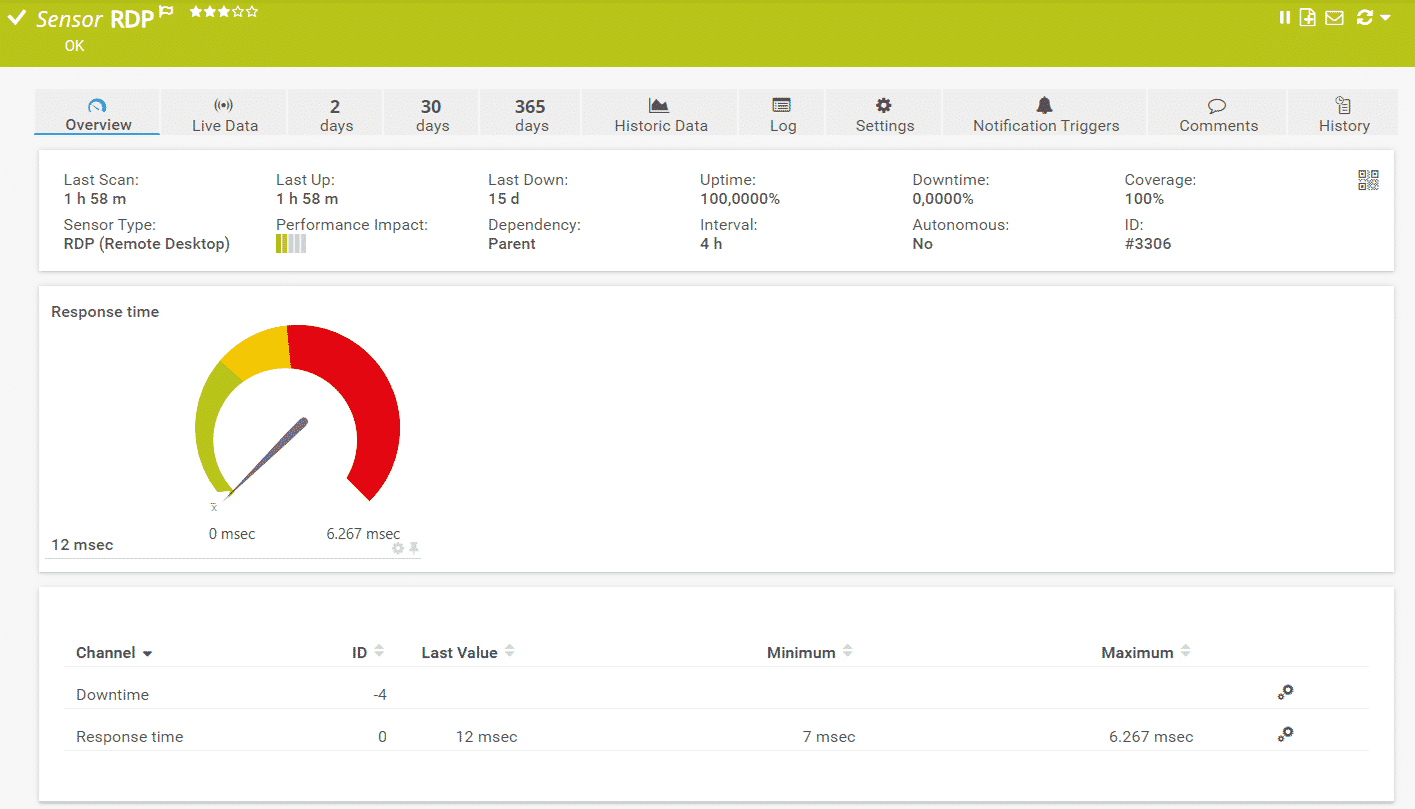
- RDP (Remote Desktop) – monitors if you can connect to your Windows Server using RDP.
Microsoft SQL
ITOps Board stores data in SQL. SQL Server can be hosted on the same machine as ITOps Board or you can have a spread installation by running it on another machine. The best practice says to separate the roles.
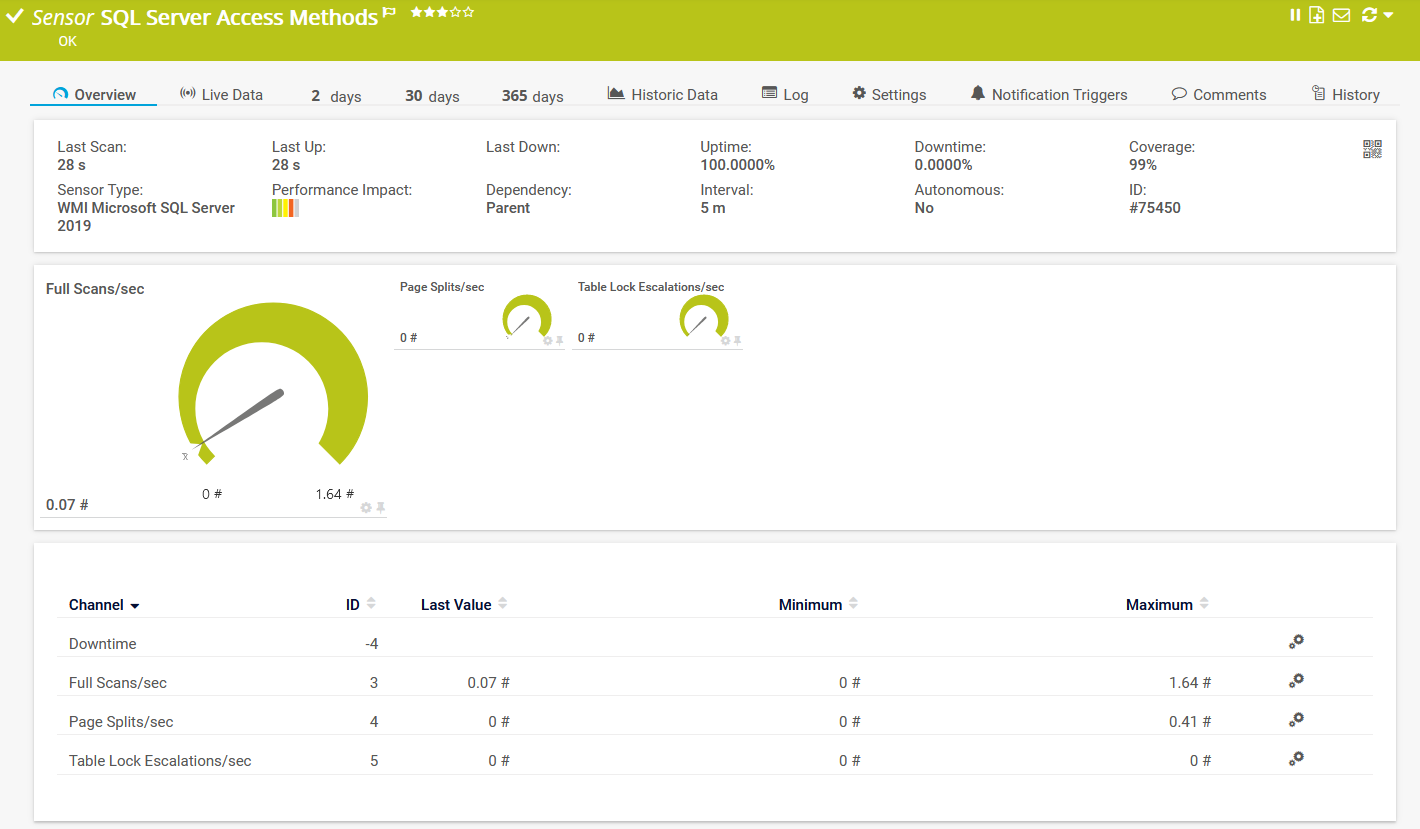
By using native SQL sensors you can get insights into the health state of your SQL Server and database. PRTG provides you with WMI Microsoft SQL Server. It monitors the performance of a Microsoft SQL Server via Windows Management Instrumentation (WMI). The sensor version (2005, 2012, 2014, 2016, 2017 and 2019) must much installed SQL version.
That’s not all. PRTG also provides you with Microsoft SQL v2 sensor. This sensor monitors a database on a Microsoft SQL Server and executes a query. In other words, you can create an SQL script and import it into PRTG for monitoring purposes.
Microsoft IIS
IIIS is a Microsoft web server. It comes as part of the ITOps Board installer, and it is required to access your ITOps Board web UI. There are several sensors you can use to monitor IIS metrics and check HTTP loading time and SSL certificate validity.
Let’s start with IIS. PRTG provides you with two native IIS sensors, Windows IIS Application and PerfCounter IIS Application Pool.
The Windows IIS Application sensor monitors a Microsoft Internet Information Services (IIS) server via Windows Management Instrumentation (WMI). It can also monitor applications that use IIS, such as Microsoft SharePoint or Microsoft Reporting Services (SSRS).
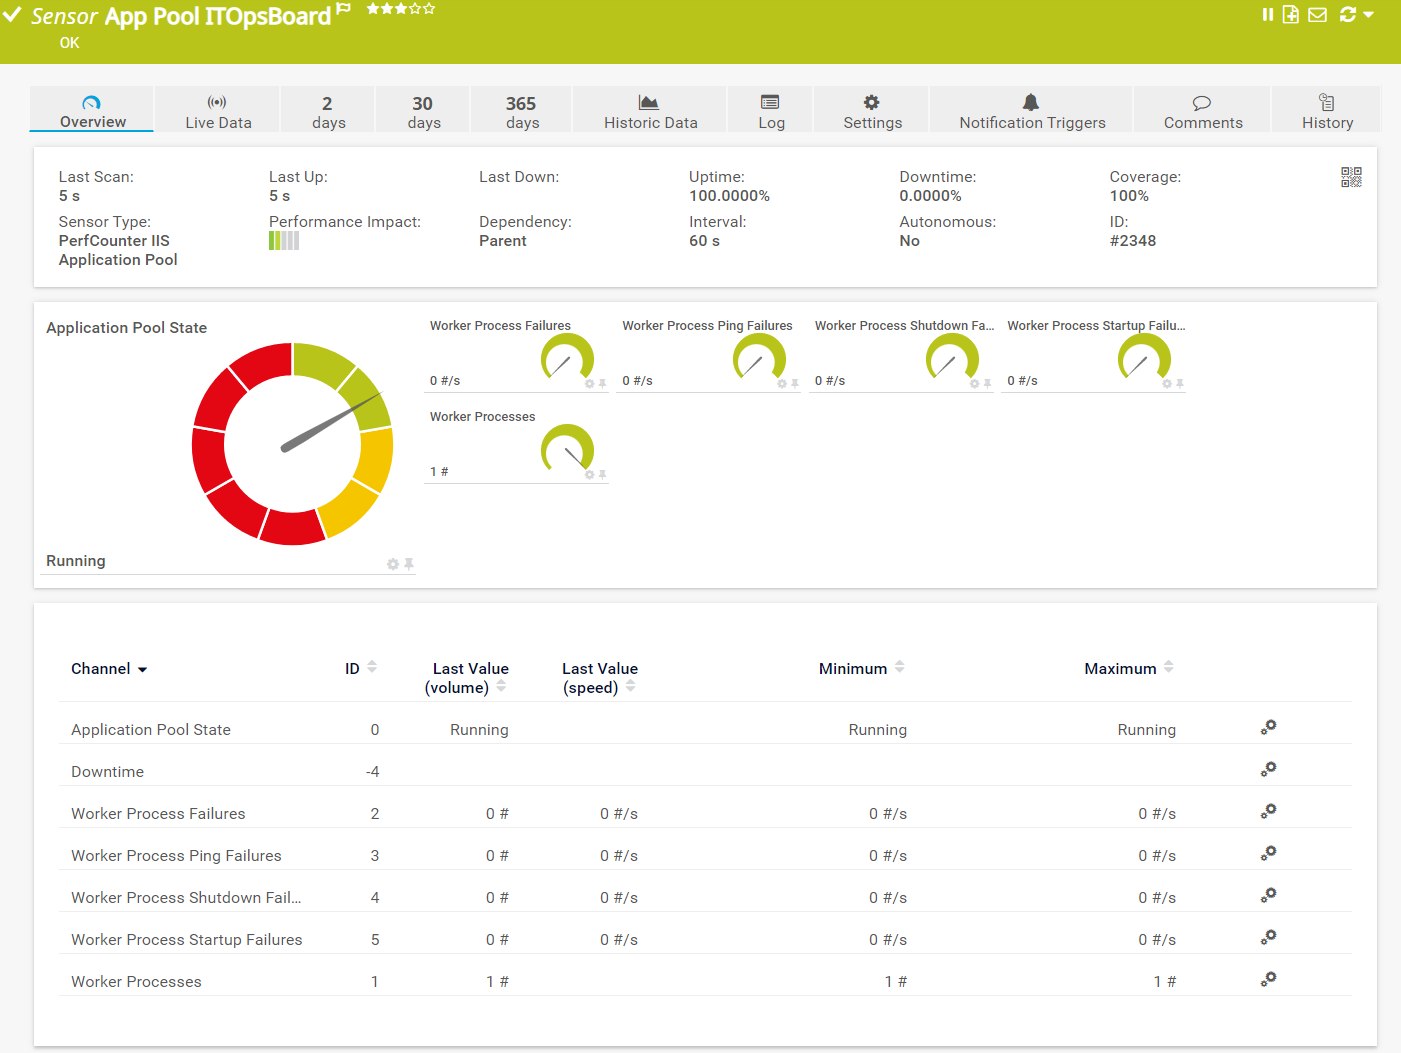
The PerfCounter IIS Application Pool sensor monitors a Microsoft Internet Information Services (IIS) application pool via Windows performance counters.
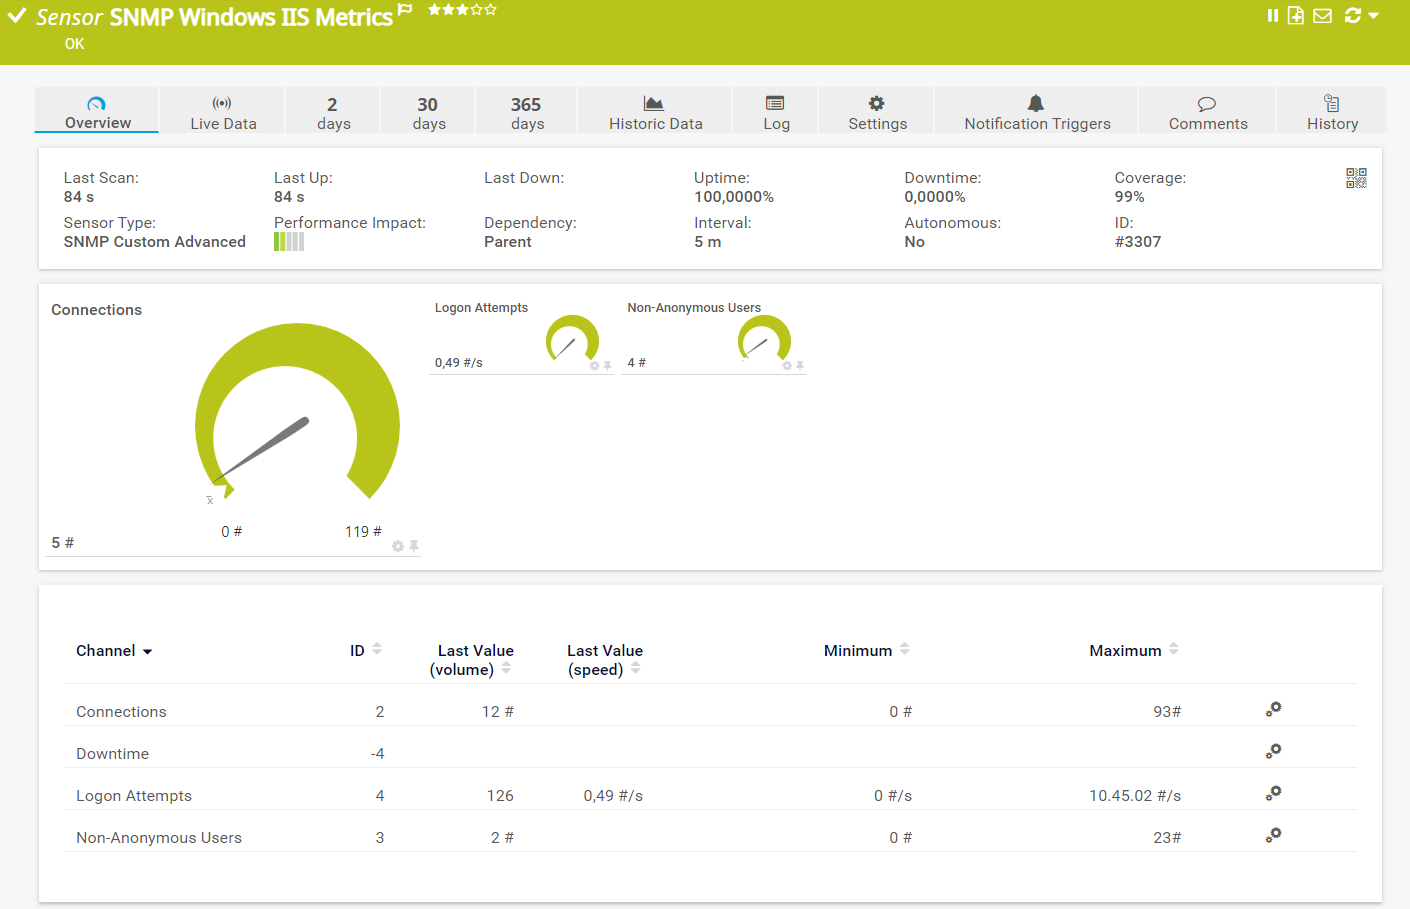
Besides that, you can also use SNMP Custom Advanced sensor to monitor IIS metrics. For example, by using OIDs 1.3.6.1.4.1.311.1.7.3.1.13.0, 1.3.6.1.4.1.311.1.7.3.1.8.0 and 1.3.6.1.4.1.311.1.7.3.1.16.0, you can get details about connections count, non-anonymous users count and logon attempts count.
In addition to mentioned sensors, your can also use script developed by one of our customers and import it into PRTG. The script shows IIS statistics. You can download it on this link.
HTTP and SSL certificate
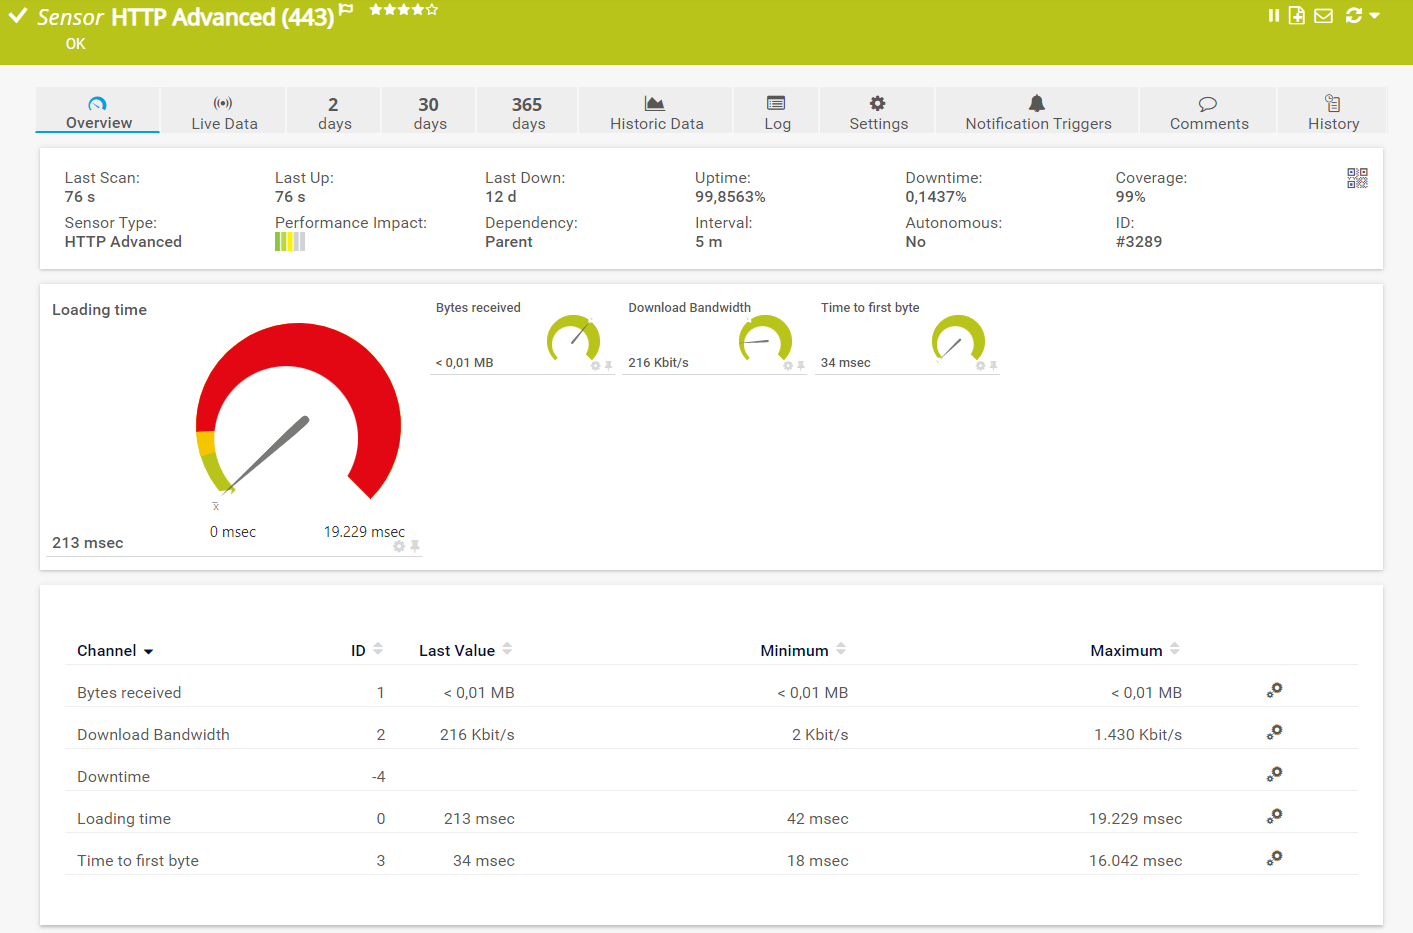
That’s not all. ITOps Board using your favorite web browser, hence you need to monitor website availability. You can do it using an HTTP sensor. This sensor shows loading time, bytes received, download bandwidth, and time to the first byte. If website is not available, this sensor will go down and PRTG will notify you accordingly.
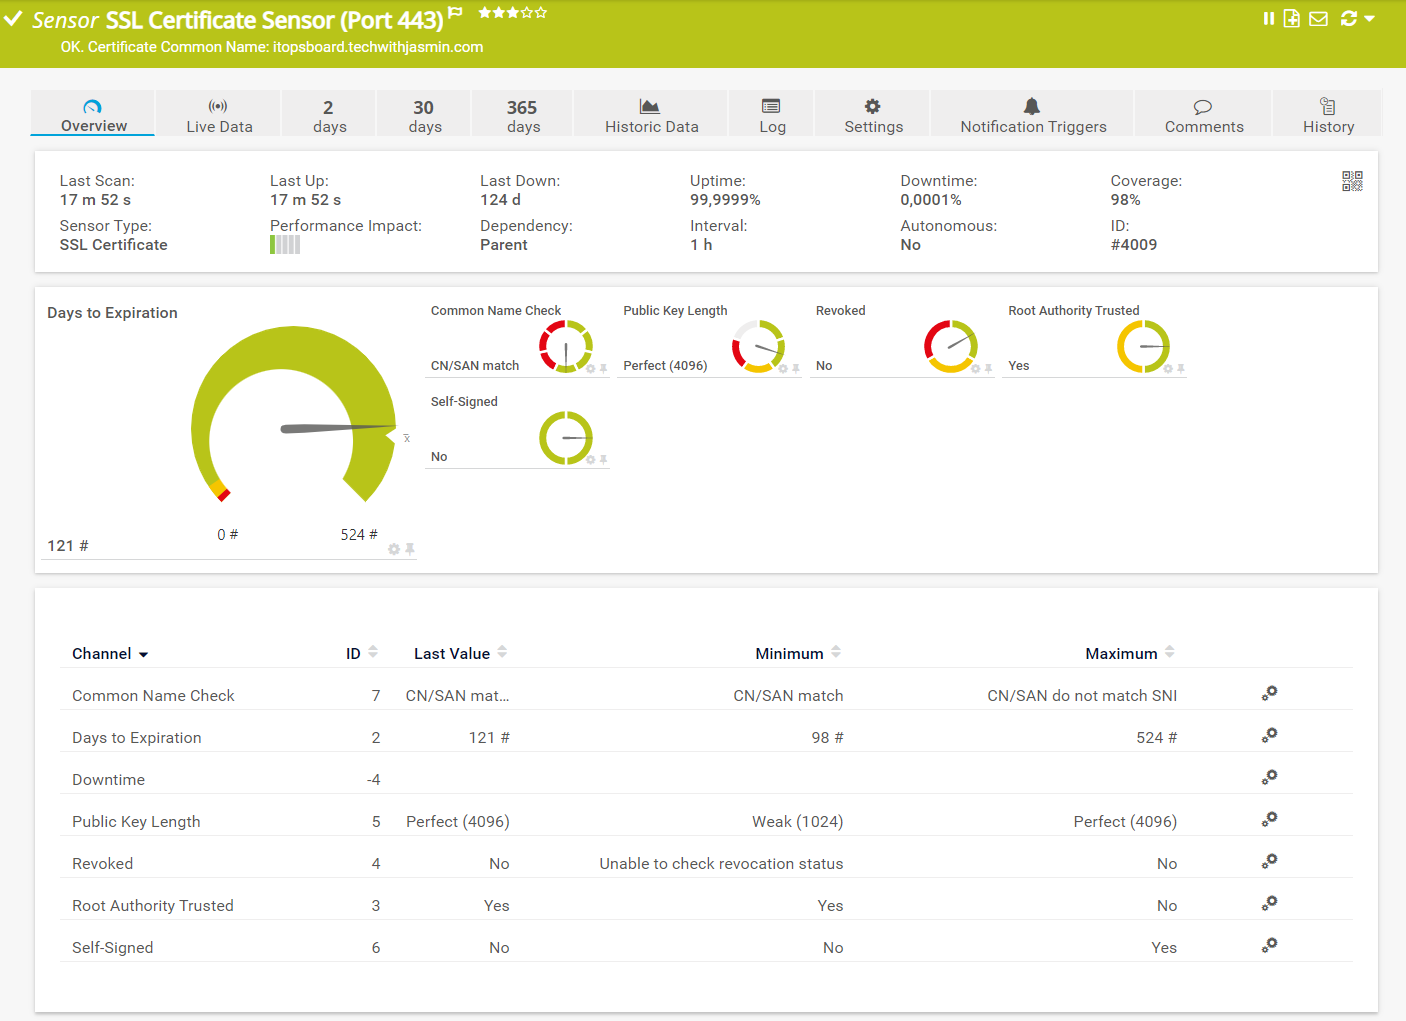
The best practice says that you need to run an SSL certificate on your websites and monitor it accordingly. In my case, you can see that this SSL certificate will expire in 121 days.
ITOps Board
ITOps Board is a commercial product, and it requires a license. The license is included in the PRTG Enterprise Monitor package. Whatever key you use (30 days trial or commercial), you can monitor it by querying ITOps Board API. As I am running several ITOps Board servers in my environment, I want o keep an eye on the license key status.
For that purpose, I use PowerShell script and EXE/Script Advanced sensor. The EXE/Script Advanced sensor runs an executable file (.exe, .dll) or a script (batch file, VBScript, PowerShell) on the probe system. PRTG will send me a notification before the license expires. Isn’t that convenient?
You find this useful and you’d like to use the script? Feel free to comment or ping me.
Elasticsearch
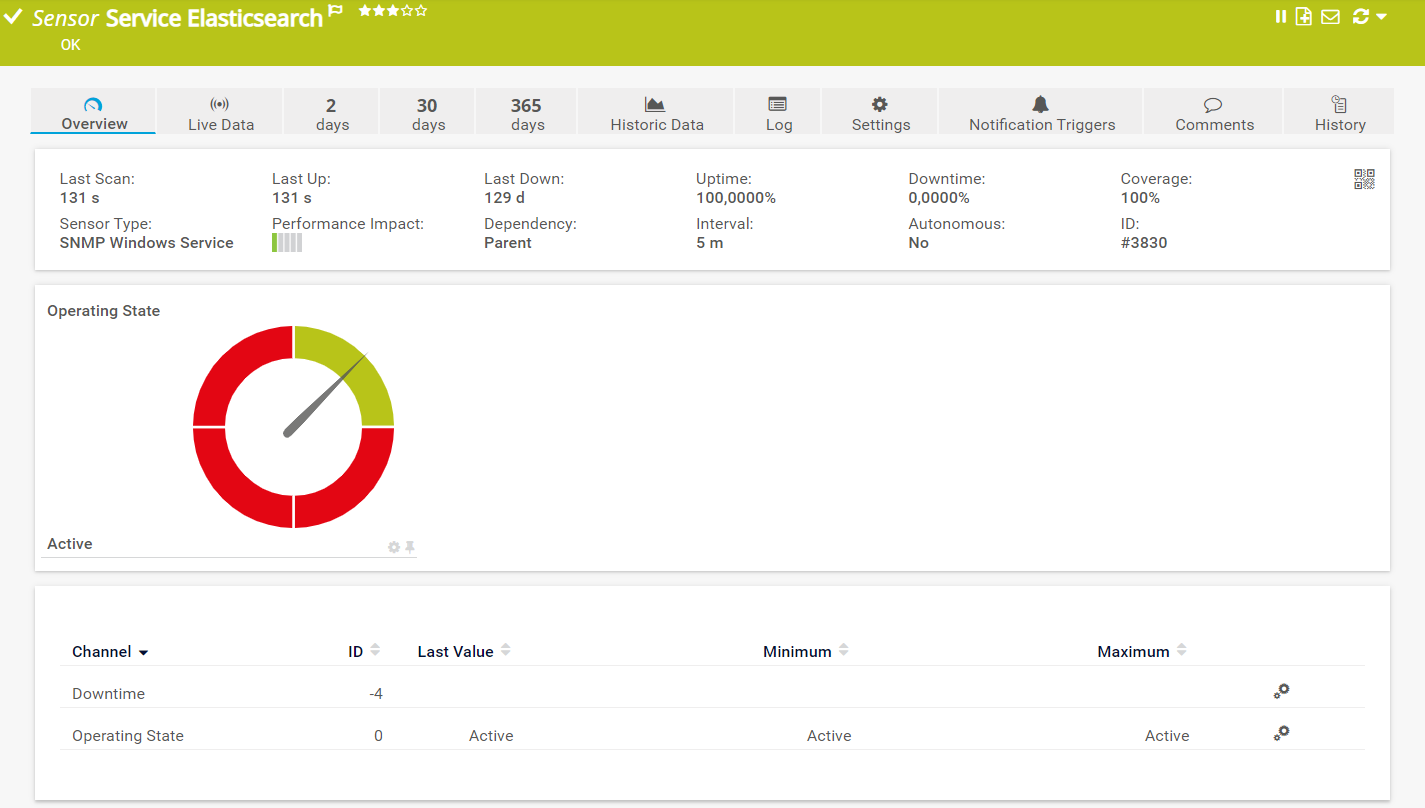
The Elastic Search Platform is a data store, search engine, and analytics solution. ITOps Board uses it to provide you with the needed data. At this moment, you can monitor if service is running or not.
Navigate to your PRTG web console and add SNMP Windows Service sensor. If service is not working properly, you will be informed by PRTG.
Underlying layer
Your ITOps Board is probably hosted as a virtual machine on on-premises or cloud. Whatever is the case, the best practice teach us to monitor all underlying layer which instability might affect your PRTG Enterprise Monitor.
In other words, if you host your ITOps Board on Hyper-V or VMware, you need to monitor hypervisors, storage and network. I already talked about it in these two articles published on Paessler blog.
- Get more visibility into Hyper-V Server with PRTG
- Get more visibility of VMware ESXi: Metrics you should be monitoring
I hope you find this article valuable. If so, feel free to share it with your network using social media button below.


